
XEQT and XGRO are two popular all-in-one ETFs for Canadian investors. Both provide diversified exposure to thousands of investments, automatically rebalance their underlying holdings, and make building a long-term portfolio relatively simple.
But there’s one important difference.
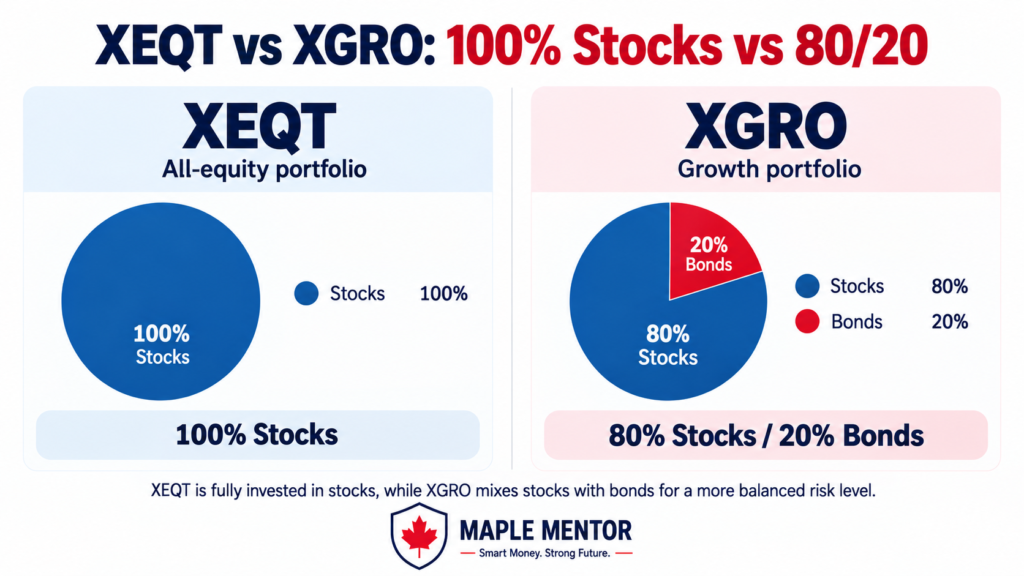
XEQT invests entirely in stocks, while XGRO targets 80% stocks and 20% bonds.
That might not sound like a major difference, but it can affect how your portfolio behaves during market downturns, how much volatility you experience, and whether you can comfortably stick with your investment strategy.
The XEQT vs XGRO decision isn’t really about choosing the ETF with the highest historical return.
It’s about determining how much investment risk you can reasonably afford, and how much you’re willing to tolerate.
Let’s compare both ETFs and determine whether adding bonds to your portfolio makes sense.
XEQT vs XGRO: Quick Answer
XEQT is designed for investors seeking 100% equity exposure.
It invests in Canadian, U.S., developed international, and emerging-market stocks through underlying ETFs.
Because XEQT doesn’t have a strategic allocation to bonds, investors receive full exposure to stock-market movements.
XGRO targets approximately 80% equities and 20% fixed income.
It provides similar global stock-market exposure but allocates part of the portfolio to bonds.
That fixed-income allocation is intended to provide diversification and potentially reduce overall portfolio volatility.
Both ETFs are managed by iShares Canada, part of BlackRock, and automatically rebalance their portfolios.
The basic distinction is straightforward:
- XEQT: Maximum stock exposure, with greater potential for substantial market fluctuations.
- XGRO: Mostly stocks, with a bond allocation intended to moderate portfolio risk.
Neither is automatically better.
An investor comfortable with large market declines might prefer XEQT, while someone who values a somewhat smoother investment experience might prefer XGRO.
The important question is whether that 20% bond allocation improves your ability to reach your financial goals.
If you’re still comparing all-equity portfolios, read our XEQT vs VEQT comparison to understand the differences between these two globally diversified ETFs.
XEQT vs XGRO at a Glance
| Feature | XEQT | XGRO |
|---|---|---|
| Full name | iShares Core Equity ETF Portfolio | iShares Core Growth ETF Portfolio |
| Provider | iShares | iShares |
| Target equity allocation | 100% | 80% |
| Target fixed-income allocation | 0% | 20% |
| Canadian stocks | Yes | Yes |
| U.S. stocks | Yes | Yes |
| International stocks | Yes | Yes |
| Bonds | No strategic allocation | Yes |
| Management fee | 0.17% | 0.17% |
| MER | 0.19% | 0.19% |
| Automatic rebalancing | Yes | Yes |
| Distributions | Quarterly | Quarterly |
| Trading currency | CAD | CAD |
| General risk profile | All-equity | Growth-oriented balanced |
| Main advantage | Full equity exposure | Additional fixed-income diversification |
Fees reflect the figures published by iShares in the supplied fund information. Verify current fees and distributions before investing.
Official fund information:
XEQT iShares Core Equity ETF Portfolio
XGRO iShares Core Growth ETF Portfolio
What About Fees?
Interestingly, fees aren’t currently a meaningful deciding factor in XEQT vs XGRO.
Both ETFs have a published management fee of 0.17% and MER of 0.19%.
On a $10,000 investment, a 0.19% MER represents approximately:
$19 per year.
On a $100,000 investment:
$190 per year.
These expenses are reflected in the funds’ performance rather than appearing as separate annual bills.
Because both ETFs currently have the same MER, choosing between them should primarily come down to asset allocation rather than cost.
What Does Adding 20% Bonds Actually Change?
This is the most important part of the comparison.
To understand XEQT vs XGRO, you need to understand what bonds are supposed to accomplish inside a portfolio.
Stocks and bonds represent fundamentally different investments.
When you buy stocks, you’re purchasing ownership in businesses.
When you invest in bonds, you’re generally lending money to governments or corporations in exchange for contractual payments and repayment obligations.
Their risks and expected returns differ.
Why Investors Add Bonds
The main reason investors add bonds to a portfolio isn’t necessarily to maximize returns.
It’s to change the portfolio’s risk characteristics.
High-quality bonds can provide several benefits.
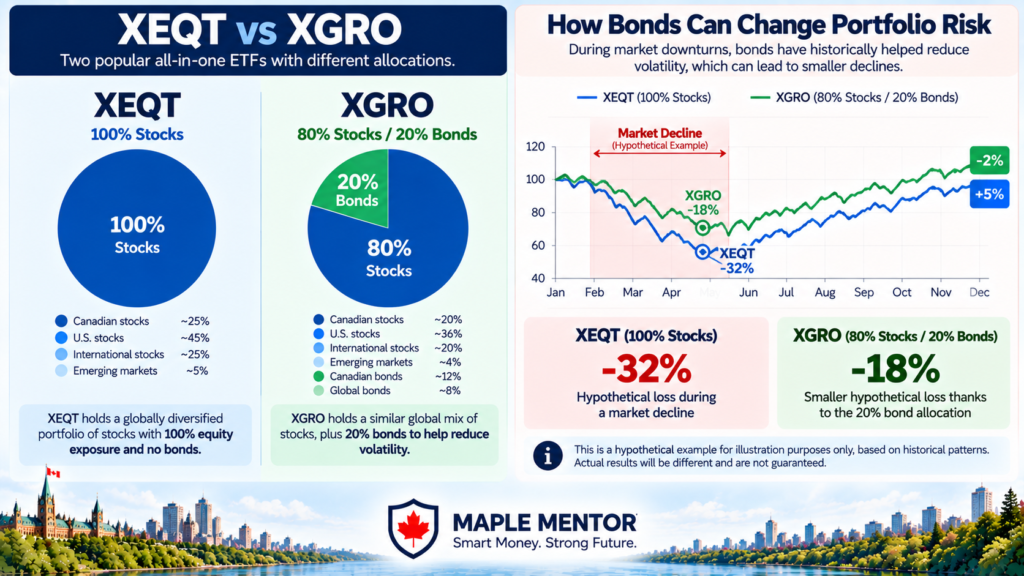
1. Potentially lower portfolio volatility
Stocks can experience significant price fluctuations.
High-quality bonds have historically tended to fluctuate less than stocks over many periods, although this isn’t guaranteed.
Adding bonds can therefore reduce the size of some portfolio movements.
2. Diversification
Stocks and bonds don’t always move in the same direction.
During certain stock-market downturns, government bonds have performed relatively well.
That can help offset some equity losses.
3. Rebalancing opportunities
When stocks fall significantly relative to bonds, a balanced portfolio can rebalance by shifting some value from bonds toward stocks.
XGRO handles this rebalancing internally as needed.
4. A potentially easier investment experience
This benefit is often overlooked.
A portfolio that fluctuates less may be easier to hold through difficult markets.
And maintaining your investment strategy can matter more than choosing the theoretically highest-returning allocation.
Bonds Aren’t Risk-Free
It’s important not to confuse bonds with guaranteed savings accounts.
Bond prices can decline.
Two major risks are:
Interest-rate risk: When market interest rates rise, existing fixed-rate bonds generally decline in market value.
Credit risk: A bond issuer might experience financial difficulties or fail to meet its obligations.
Longer-duration bonds are generally more sensitive to interest-rate changes.
Government bonds and corporate bonds also have different credit-risk characteristics.
That’s why XGRO’s bond allocation shouldn’t be treated as equivalent to holding 20% of your money in a high-interest savings account.
Bonds Don’t Always Rise When Stocks Fall
Investors sometimes assume that when stocks decline, bonds automatically increase in value.
That’s incorrect.
There are periods when both asset classes lose money simultaneously.
For example, rapidly rising interest rates can negatively affect bond prices while also putting pressure on stock valuations.
In that environment, XGRO’s bonds might provide less protection than expected.
The purpose of adding bonds is to improve diversification and potentially moderate risk over time, not to guarantee positive returns during every downturn.
XEQT vs XGRO Risk: What Could a Bad Year Look Like?
Let’s use a few hypothetical examples.
These are simplified illustrations, not historical fund returns or forecasts.
We’ll assume you invest $10,000 and ignore fees, taxes, distributions, and rebalancing effects.
XEQT is represented by a 100% stock portfolio.
XGRO is represented by an 80% stock and 20% bond portfolio.
Scenario 1: Stocks Fall 30%, Bonds Gain 5%
Imagine a difficult year for global stock markets.
Stocks decline by 30%, but bonds gain 5%.
XEQT:
$10,000 × (1 − 0.30)
Ending value: $7,000
Loss: $3,000
XGRO:
Stocks: $8,000 × 0.70 = $5,600
Bonds: $2,000 × 1.05 = $2,100
Ending value: $7,700
Loss: $2,300
| Portfolio | Starting Value | Ending Value | Return |
|---|---|---|---|
| XEQT | $10,000 | $7,000 | -30% |
| XGRO | $10,000 | $7,700 | -23% |
In this example, XGRO loses $700 less.
That’s meaningful.
But notice something important.
XGRO still loses 23%.
Adding 20% bonds doesn’t transform an aggressive investment portfolio into a conservative one.
Scenario 2: Stocks Fall 20%, Bonds Fall 10%
Now imagine a year when both stocks and bonds struggle.
XEQT:
$10,000 × 0.80
Ending value: $8,000
Loss: 20%
XGRO:
Stocks: $8,000 × 0.80 = $6,400
Bonds: $2,000 × 0.90 = $1,800
Ending value: $8,200
Loss: 18%
| Portfolio | Starting Value | Ending Value | Return |
|---|---|---|---|
| XEQT | $10,000 | $8,000 | -20% |
| XGRO | $10,000 | $8,200 | -18% |
XGRO still performs slightly better in this example.
But the protection is much smaller because bonds also declined.
Scenario 3: Stocks Rise 20%, Bonds Gain 3%
What happens during a strong stock-market year?
XEQT:
$10,000 × 1.20
Ending value: $12,000
Gain: 20%
XGRO:
Stocks: $8,000 × 1.20 = $9,600
Bonds: $2,000 × 1.03 = $2,060
Ending value: $11,660
Gain: 16.6%
| Portfolio | Starting Value | Ending Value | Return |
|---|---|---|---|
| XEQT | $10,000 | $12,000 | +20% |
| XGRO | $10,000 | $11,660 | +16.6% |
Here, XEQT outperforms because its entire portfolio benefits from the strong equity market.
What These Examples Tell Us
Adding bonds changes both sides of the equation.
During some stock-market downturns, bonds can cushion losses.
During strong equity markets, bonds can reduce returns if they underperform stocks.
And during certain market environments, bonds can decline alongside equities.
This is the trade-off investors need to understand.
XGRO isn’t designed to outperform XEQT in every market. It’s designed to provide a different balance of risk and potential return.
Historical Performance: Compare More Than Returns
Historical performance can help illustrate how different allocations have behaved.
But comparing XEQT and XGRO requires some care.
Why Their Inception Dates Matter
XEQT launched in August 2019.
XGRO has a longer history, but its investment objective changed in December 2018.
That means older XGRO performance doesn’t necessarily represent the same investment strategy used by the current ETF.
You shouldn’t compare XEQT’s since-inception return directly with XGRO’s since-inception return and assume the result tells you which current allocation is better.
Instead, use matching periods that reflect both funds’ current strategies.
How to Compare Their Returns Fairly
For a useful historical comparison, examine:
- The same starting and ending dates
- Canadian-dollar returns
- Total returns with distributions reinvested
- Comparable NAV-based performance figures
- Both returns and drawdowns
For example, comparing their annualized five-year total returns over the exact same period is more meaningful than comparing different inception periods.
But even then, the higher-returning ETF isn’t automatically the better choice.
Returns Don’t Tell You Everything
Suppose XEQT produces a higher annualized return than XGRO over a particular period.
That result might be expected during a strong equity market.
But it doesn’t tell you how an investor would have reacted during the worst decline.
Consider two investors.
Investor A holds XEQT and sells after a major market decline because the losses become overwhelming.
Investor B holds XGRO and continues investing throughout the downturn.
Even if XEQT eventually produces a higher long-term fund return, Investor B could achieve a better personal outcome by maintaining a consistent strategy.
Your actual results depend on more than the ETF’s published performance.
They also depend on your contributions, withdrawals, timing, and behaviour.
Past performance doesn’t guarantee future returns.
Which Fits Your Time Horizon and Risk Tolerance?
A common investing rule suggests that younger investors should own more stocks while older investors should own more bonds.
There’s some logic behind it.
Someone investing for several decades may have more time to recover from stock-market downturns.
But age alone isn’t enough to determine the right allocation.
Two 25-year-olds can have completely different financial circumstances.
One might have stable employment, a large emergency fund, and no major planned expenses.
The other might be saving for a home, carrying substantial debt, or expecting to need their investments within a few years.
Their ability to accept investment losses could be very different.
Risk Tolerance vs Risk Capacity
These two concepts are related, but they aren’t identical.
Risk tolerance is your psychological willingness to experience investment losses.
Risk capacity is your financial ability to absorb those losses without jeopardizing your goals.
You might feel comfortable watching your portfolio decline by 40%.
But if you need that money for a home purchase next year, your financial ability to absorb the loss could be extremely limited.
Alternatively, you might have a 30-year investment horizon but struggle emotionally with a 15% decline.
That matters too.
A suitable portfolio should account for both.
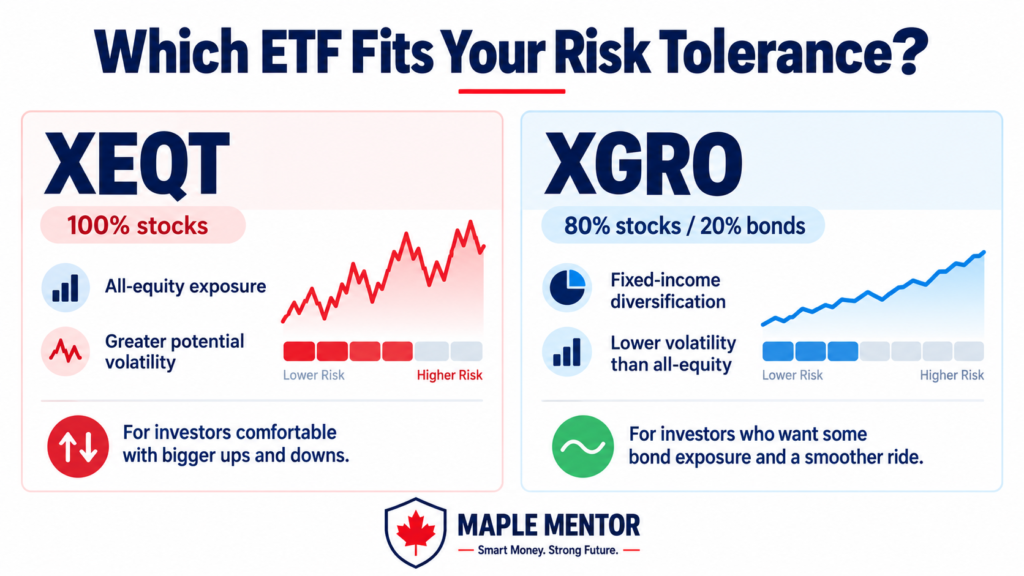
When XEQT May Make Sense
XEQT may be appropriate for investors who:
- Have a long investment horizon
- Want a globally diversified all-equity portfolio
- Can financially withstand significant market declines
- Are comfortable with substantial volatility
- Don’t need the invested money in the near future
Because XEQT is effectively 100% stocks, you should be prepared for the possibility of major losses during severe bear markets.
When XGRO May Make Sense
XGRO may be appropriate for investors who:
- Have a long-term investment horizon
- Want substantial equity exposure
- Prefer some fixed-income diversification
- Are uncomfortable with a fully equity-based portfolio
- Want an automatically rebalanced 80/20 allocation
It’s still an aggressive investment.
An 80% equity allocation can experience substantial declines.
But the 20% bond component may make the portfolio easier to maintain through some market conditions.
When Neither ETF Is Appropriate
This is an important point.
If you’re saving for a home purchase in two years, choosing XGRO instead of XEQT doesn’t necessarily solve the problem.
Both funds have significant stock-market exposure.
Both can decline substantially over relatively short periods.
Money needed for a near-term financial goal may be better suited to lower-risk options such as high-interest savings accounts or appropriate GICs.
The exact choice depends on your timeline, liquidity needs, and circumstances.
A 20% bond allocation doesn’t automatically make an ETF suitable for short-term savings.
Explore our Best ETFs for Long-Term Growth in Canada guide for other long-term investment options.
Should You Hold Both XEQT and XGRO?
Yes, you can hold both.
But it’s important to understand what you’re accomplishing.
XEQT and XGRO have substantial overlap in their underlying stock exposure.
Buying both doesn’t suddenly provide access to entirely different stock markets.
Instead, you’re primarily changing your overall stock-and-bond allocation.
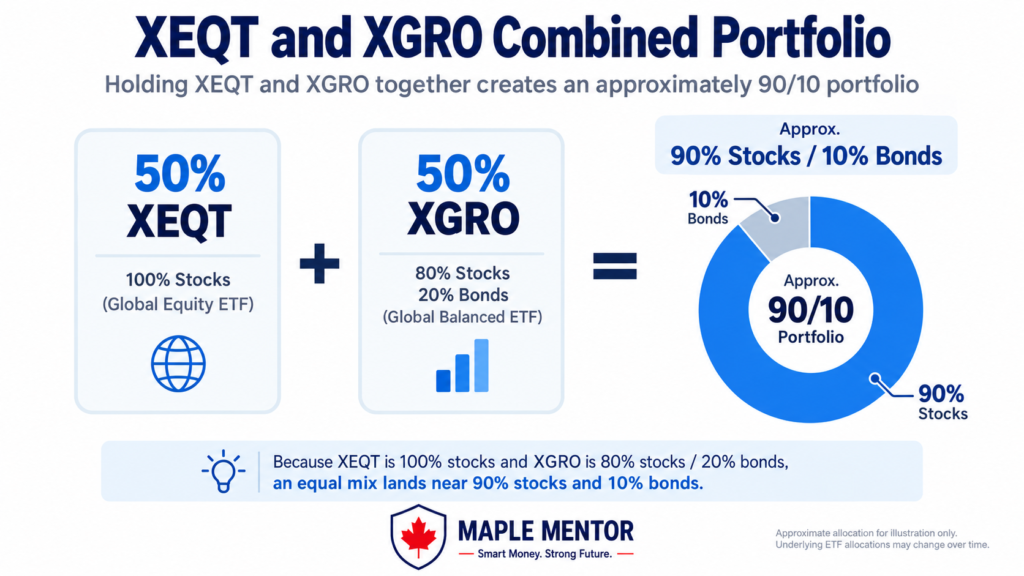
Example: 50% XEQT and 50% XGRO
Suppose you have a $20,000 portfolio.
You invest:
$10,000 in XEQT
$10,000 in XGRO
XEQT targets 100% equities.
XGRO targets 80% equities and 20% fixed income.
Your approximate combined allocation becomes:
| Investment | Stocks | Bonds |
|---|---|---|
| $10,000 XEQT | $10,000 | $0 |
| $10,000 XGRO | $8,000 | $2,000 |
| Total | $18,000 | $2,000 |
That gives you:
90% stocks
10% bonds
So a 50/50 XEQT and XGRO portfolio creates an approximate 90/10 allocation.
Other Possible Combinations
| XEQT Allocation | XGRO Allocation | Approximate Stocks | Approximate Bonds |
|---|---|---|---|
| 100% | 0% | 100% | 0% |
| 75% | 25% | 95% | 5% |
| 50% | 50% | 90% | 10% |
| 25% | 75% | 85% | 15% |
| 0% | 100% | 80% | 20% |
These figures assume both ETFs remain at their target allocations.
Actual weights can vary slightly with market movements and fund rebalancing.
Is Holding Both Worth It?
It can be reasonable if you deliberately want an allocation between 80/20 and 100/0.
For example, an investor might prefer 90% stocks and 10% bonds.
Holding both ETFs offers a relatively simple way to achieve that target.
However, there is one disadvantage.
You’ll need to manage the allocation between the two ETFs yourself.
Each fund automatically rebalances its own underlying holdings, but neither fund maintains your overall XEQT/XGRO split.
If one ETF grows faster than the other, your combined allocation will gradually change.
You may need to rebalance through new contributions or occasional trades.
For investors who prioritize simplicity, choosing one ETF with an appropriate allocation may be easier.
XEQT vs XGRO: Final Verdict
The XEQT vs XGRO decision comes down to how much equity exposure you want and how much volatility you can realistically handle.
Both ETFs offer diversified portfolios, automatic internal rebalancing, and relatively low fees.
Both currently have the same published 0.19% MER.
The main difference is the asset allocation.
XEQT targets 100% equities.
XGRO targets 80% equities and 20% fixed income.
Before choosing, ask yourself:
1. How long will this money remain invested?
A longer investment horizon may provide more time to recover from market declines, but it doesn’t eliminate investment risk.
2. How would I react to a major portfolio decline?
If a substantial loss would cause you to sell, a fully equity-based portfolio might not match your actual risk tolerance.
3. Can I financially afford those losses?
Money needed for a near-term goal generally shouldn’t be exposed to significant market risk.
4. What do I already own?
Your existing investments matter.
If you already have significant stock exposure elsewhere, adding XEQT could make your overall portfolio more aggressive than intended.
5. Am I choosing based on my investment plan or recent performance?
Don’t choose XEQT simply because stocks have recently outperformed bonds.
And don’t choose XGRO solely because you’re worried about the next market correction.
Your allocation should reflect a long-term strategy.
f you’re building a portfolio inside a TFSA, see our Best ETFs for TFSA in Canada guide.
The Bottom Line
Choose XEQT if you deliberately want a globally diversified, all-equity portfolio and can tolerate substantial market volatility.
Choose XGRO if you want a globally diversified portfolio with approximately 80% stocks and 20% bonds to provide additional fixed-income diversification.
Neither guarantees better results.
And neither is appropriate for every investment goal.
The best portfolio isn’t necessarily the one with the highest potential return.
It’s the one that balances your financial objectives, risk capacity, and willingness to stay invested through difficult markets.
FAQ
What is the main difference between XEQT and XGRO?
The main difference is their target asset allocation.
XEQT targets 100% equities, while XGRO targets approximately 80% equities and 20% fixed income.
Both provide diversified exposure to global markets and automatically rebalance their underlying portfolios.
Is XGRO safer than XEQT?
XGRO generally has a less aggressive asset allocation because it includes 20% fixed income.
That bond allocation may reduce portfolio volatility and cushion losses during certain stock-market downturns.
However, XGRO can still experience substantial losses, and bonds don’t always rise when stocks fall.
It should not be considered a low-risk investment.
Should young investors always choose XEQT?
No.
Age alone shouldn’t determine an investor’s asset allocation.
A younger investor may have a long investment horizon but limited financial capacity to absorb losses.
Another investor might have decades until retirement but be uncomfortable with major portfolio fluctuations.
Investment horizon, risk tolerance, financial stability, and upcoming expenses all matter.
Does holding both XEQT and XGRO make sense?
It can.
Holding both allows investors to create an allocation between XEQT’s 100% equities and XGRO’s 80% equities.
For example, a 50/50 split produces an approximate allocation of 90% stocks and 10% bonds.
However, the ETFs have substantial overlapping holdings, and investors must maintain their desired split between the funds.
Can XGRO lose money when stocks fall?
Yes.
XGRO still targets approximately 80% equities.
A significant stock-market decline can therefore produce substantial losses.
Its bond allocation may help reduce losses in some environments, but bonds can also decline in value.
Should I switch from XEQT to XGRO as retirement approaches?
Possibly, but not automatically.
As retirement approaches, your investment horizon, withdrawal needs, and ability to recover from losses may change.
Some investors gradually increase their fixed-income allocation to reduce portfolio volatility.
However, the appropriate allocation depends on factors such as retirement income sources, spending needs, other assets, and risk tolerance.
Switching from XEQT to XGRO may be one option, but an 80/20 portfolio could still be too aggressive for some retirees.